Examining Ethereum 2 Network Performance
The Ethereum 2 network is a massively complex entity, but a single metric encompassing its performance is very useful. This article describes such a metric.
A version of this article first appeared in the December edition of the Attestant Ethereum 2 update.
The Ethereum 2 network is a massively complex entity, with thousands of nodes sending and receiving hundreds of thousands of messages every epoch. Defining a single performance metric will never capture the nuance of the various components, but it can be useful in providing a high-level indicator of the resultant chain, highlighting where issues are occurring or improvements could be made.
One commonly used metric is participation. A validator "participates" in the chain if an attestation by it is recorded on the chain over a given time period. Although useful, participation is a somewhat broad brush: an attestation consists of multiple parts, so participation measured simply by the presence of an attestation does not by itself show the network performing well. Indeed, the Ethereum 2 network is designed such that it rewards validators for acting in a way that is good for the chain, not merely for participating. Each correct element in an attestation results in a reward to the validator. In addition, the timeliness of the attestation is also important, with attestations included early being rewarded more highly than those included later. Because rewards are tied so closely to the features that are good for the chain, they open the door to using rewards as a proxy for network performance.
The key here is to compare the actual rewards obtained across a number of validators with the theoretical maximum that could be obtained if those validators attested perfectly. This metric has a number of features that make it very useful:
- it can be calculated for each individual epoch or aggregated across multiple epochs, which allows it to be used as both a short-term and long-term measure of performance
- it can be calculated for individual validators, arbitrary groups, or for all active validators, which allows it to be used for comparative purposes
- it is independent of the numerical rewards provided, which allows it to be used for comparisons across different points in time in the beacon chain's history
The closer the obtained rewards are to the maximum possible rewards, the better the network is performing. As such, the value is best expressed as a percentage and we define the rewards rate as:
It is important to note that "rewards" here refer to attestation and proposal rewards only. Slashing is explicitly excluded: the rewards provided to a proposer that includes a slashing event on-chain are not related to the normal operation of the chain, and are in fact a transfer from the validator being slashed rather than generated by the network itself, so are ignored for the purposes of this calculation.
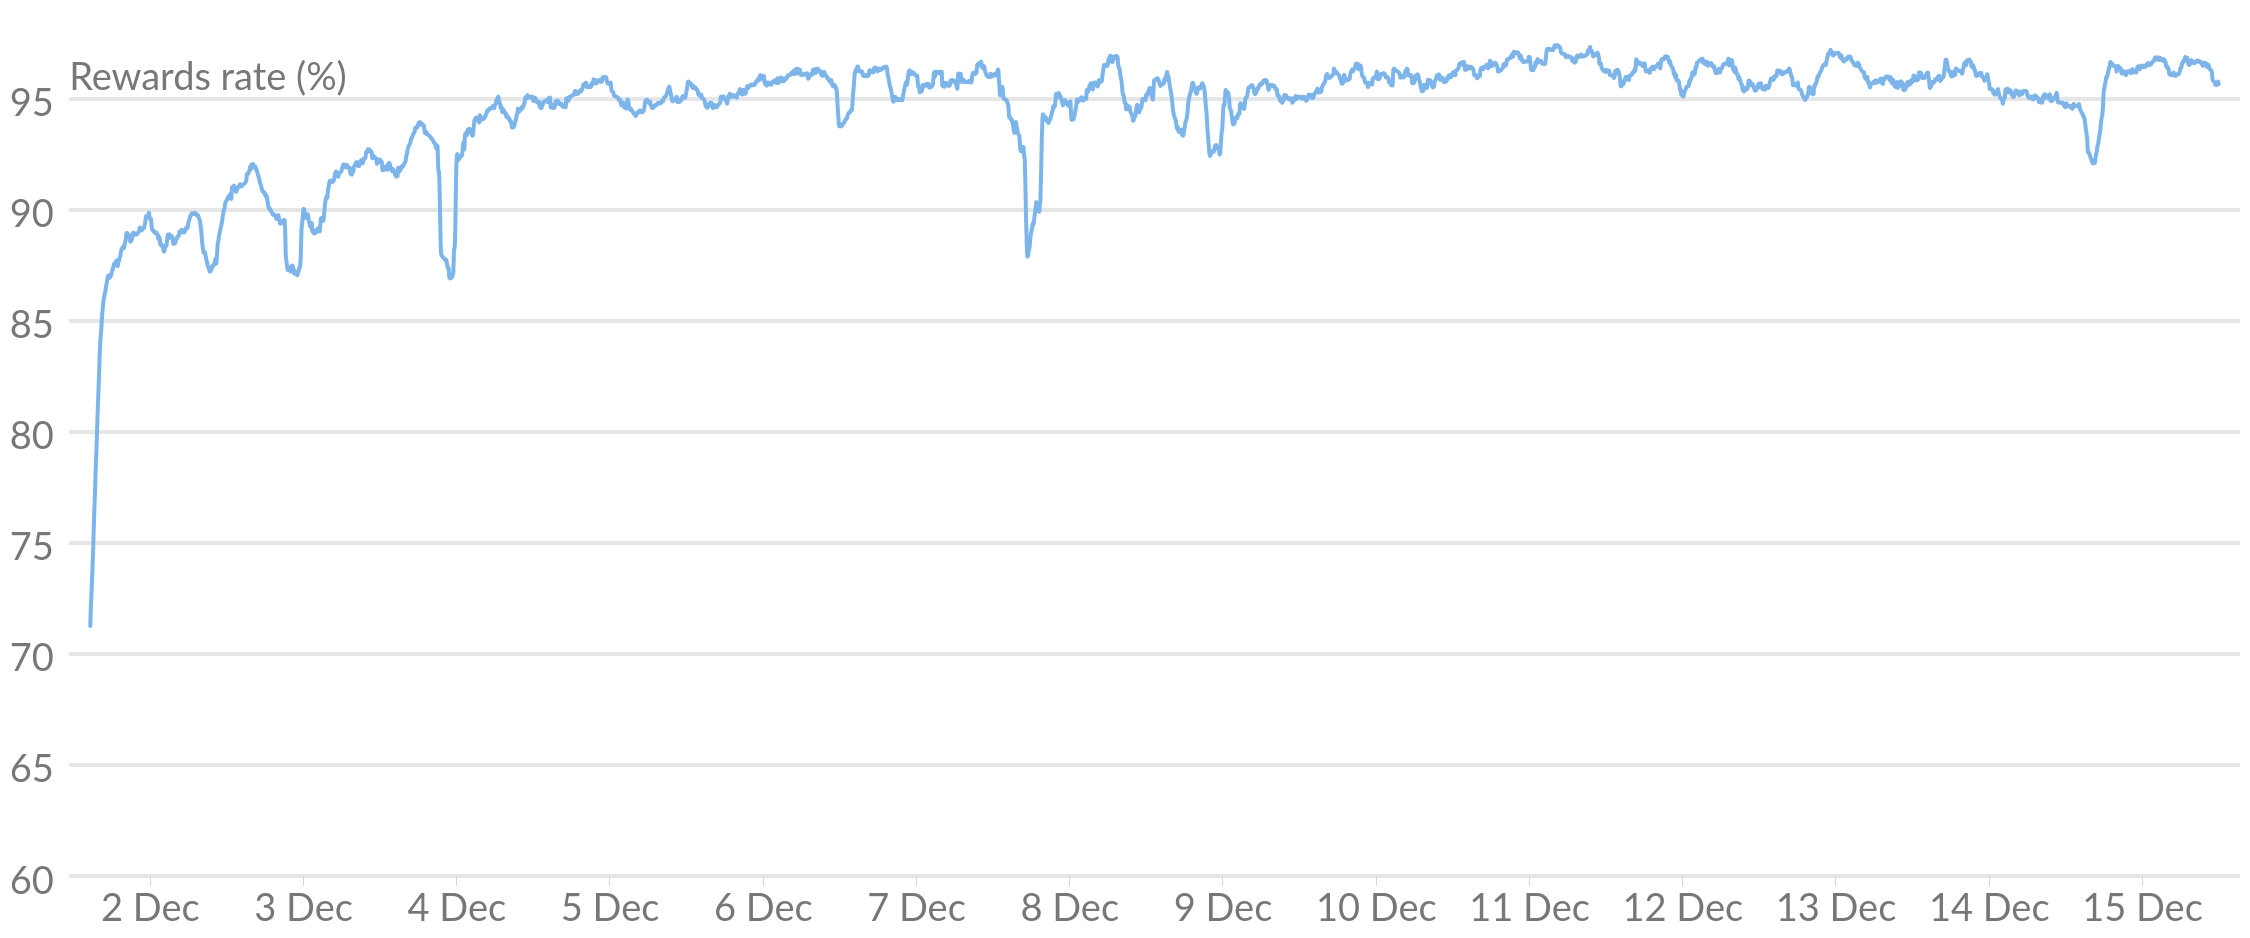
 Figure 1: Rewards rate in the first two weeks of the beacon chain (smoothed)
The chart above shows the rewards rate reaching 95% after the first couple of days and remaining generally within a few percentage points for the remainder of the duration. The rewards rate illustrates that the chain is, in general, working well.
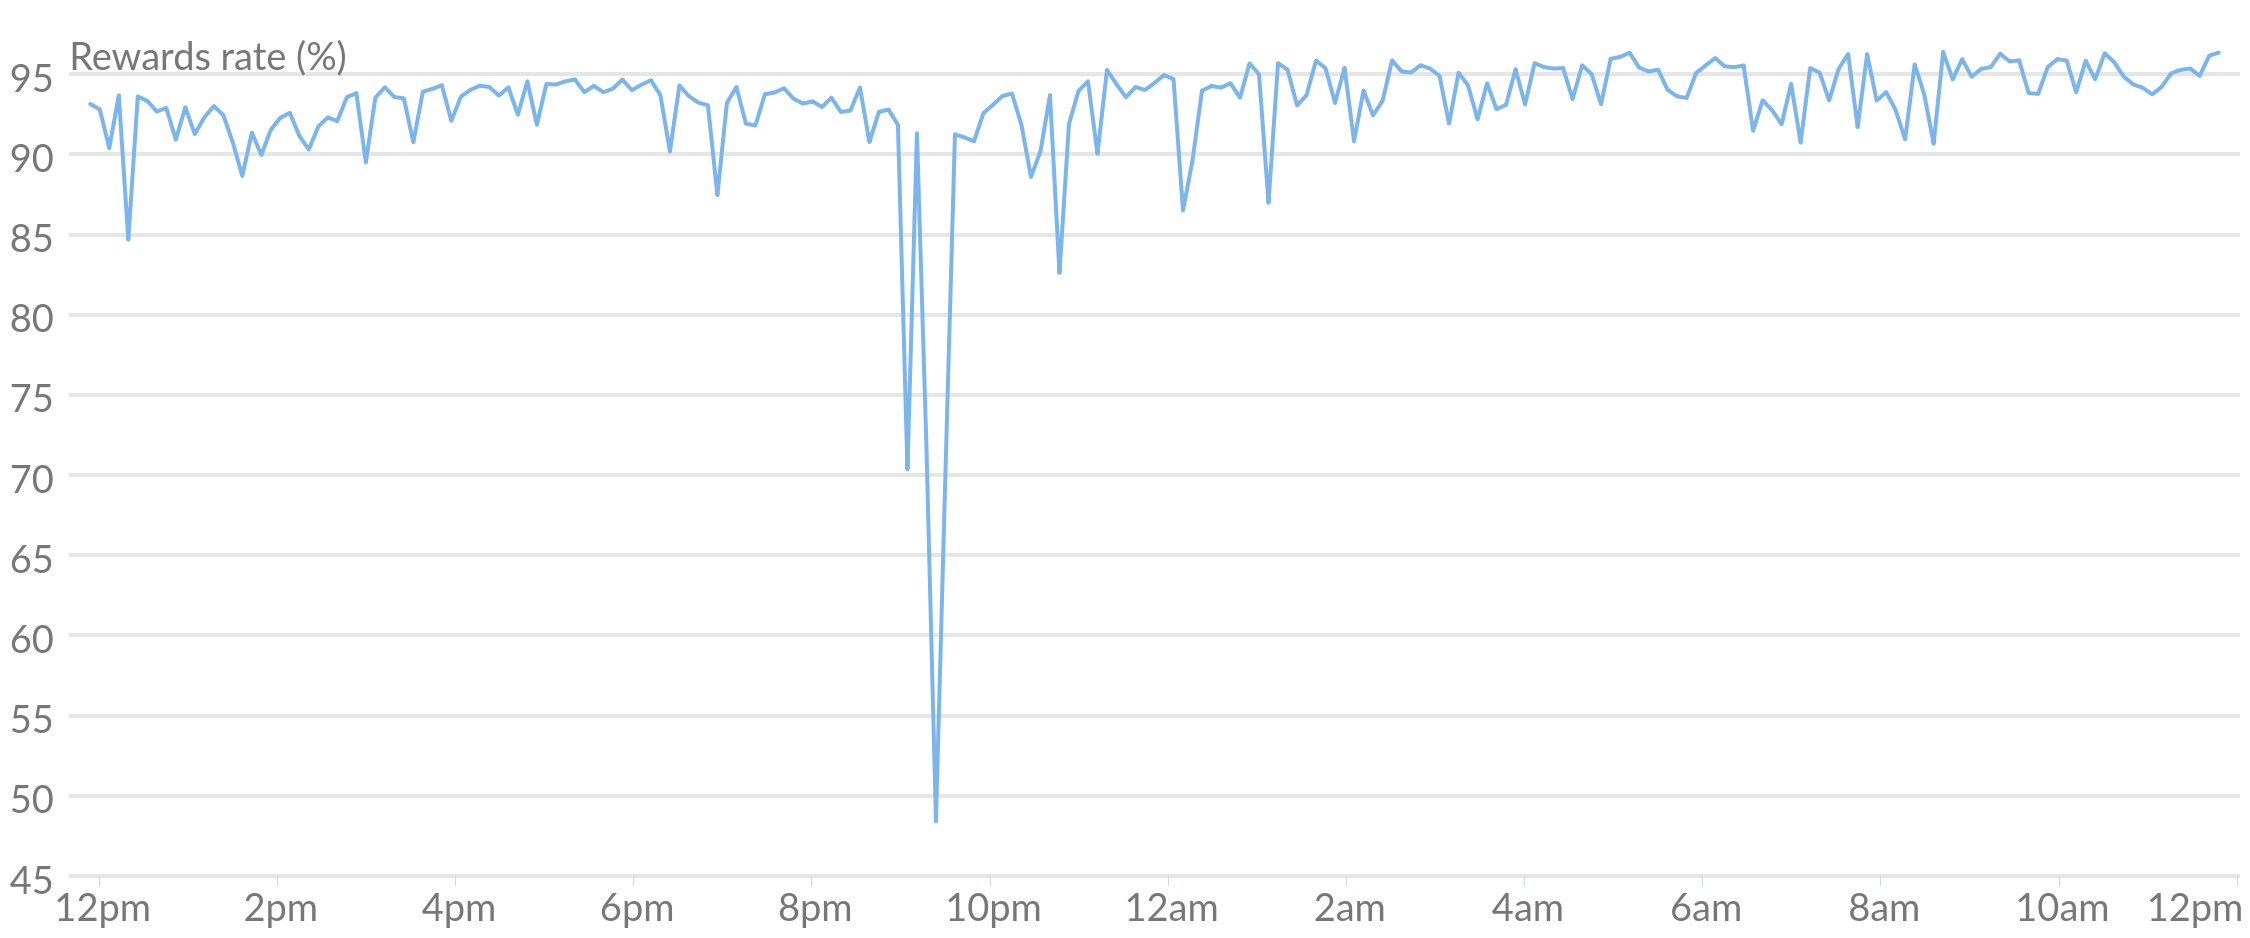
It does, however, also highlight two areas where improvements could be made. The first is consistency: there is significant variation in the rewards rate from one epoch to the next. This can be seen clearly by zooming in on sections of the graph to see rewards at a higher resolution, as shown below.
 Figure 2: Rewards rate over one day of the beacon chain
Secondly, although a rewards rate around 95% is good, it could be better. There is no reason why the rewards rate should not be near 100%, yet for the examined period the maximum rewards rate for a single epoch was 97.2% and it was more commonly below 97%, so there is room to improve.
Although the rewards rate metric can highlight these issues, it cannot provide reasons as to why they exist. Further exploration of each of these issues is required to understand the causes, and some examination of this will be undertaken in a future post.